> For the complete documentation index, see [llms.txt](https://docs.amesa.com/llms.txt). Markdown versions of documentation pages are available by appending `.md` to page URLs; this page is available as [Markdown](https://docs.amesa.com/evaluate-performance/set-kpi-and-roi.md).
# Analyze Benchmark Performance
Analyzing agent system behavior is a key part of using AMESA. This capability is key for:
* Building agent systems that beat performance benchmarks
* Monitoring the performance of your agent systems and simulators in real time
* Analyzing your agent systems and simulators to understand what went wrong in case of problems
* Creating dashboards and reports to share with stakeholders
AMESA offers multiple options for analyzing agent system behavior. For high-level summaries, you can use the benchmark reporting features in the UI. For more in-depth information, you can use the historian and benchmark data files, which provide a database of all the information gathered during training and deployment. You can also design an LLM module in your agent to provide customizable communications capacity using natural language.
## The AMESA Benchmarking Page
The AMESA benchmarking feature allows you to compare the performance of different multi-agent systems against key performance indicators (KPIs). This tool helps you evaluate your agent system's effectiveness, track its improvements, and calculate potential return on investment (ROI).
Benchmarks are generated after training is completed. After all the training episodes are finished, the system will run benchmarking episodes. These are episodes where the team of agents is controlling the process within the simulation, but unlike during training, the agents are no longer experimenting to try to learn new things - they are demonstrating the result of their learning and trying to optimize performance as best as possible. The data from these episodes will then populate the benchmark.json file and the Benchmarks page visualizations. Because benchmark episodes run after training, you won't see benchmark data while training progresses, even for long-running jobs. If a training job fails, no benchmark data will be generated.
Note: Benchmarking does not influence agent system training, goals, or rewards. It is purely an analysis tool that helps you answer the question: "Based on how this agent system was trained and how we believe it should perform in real life, how much money is this agent system generating?"
### Define the KPI for Your Project
The key performance indicator (KPI) for your project is the top-level objective that you will use to compare and evaluate your multi-agent systems' performance.
To define the KPI for your project, choose the sensor variable that represents the metric that best indicates performance success. For most processes, this is a metric with a clear business impact, such as product yield or energy use.
### Setting up the KPI
You set up the KPI when you first [create a use case](/build-multi-agent-systems/create-a-project.md), but you can also change the KPI at any time. To set up the KPI after a use case is created:
1. Navigate to the Benchmark page from the main dashboard
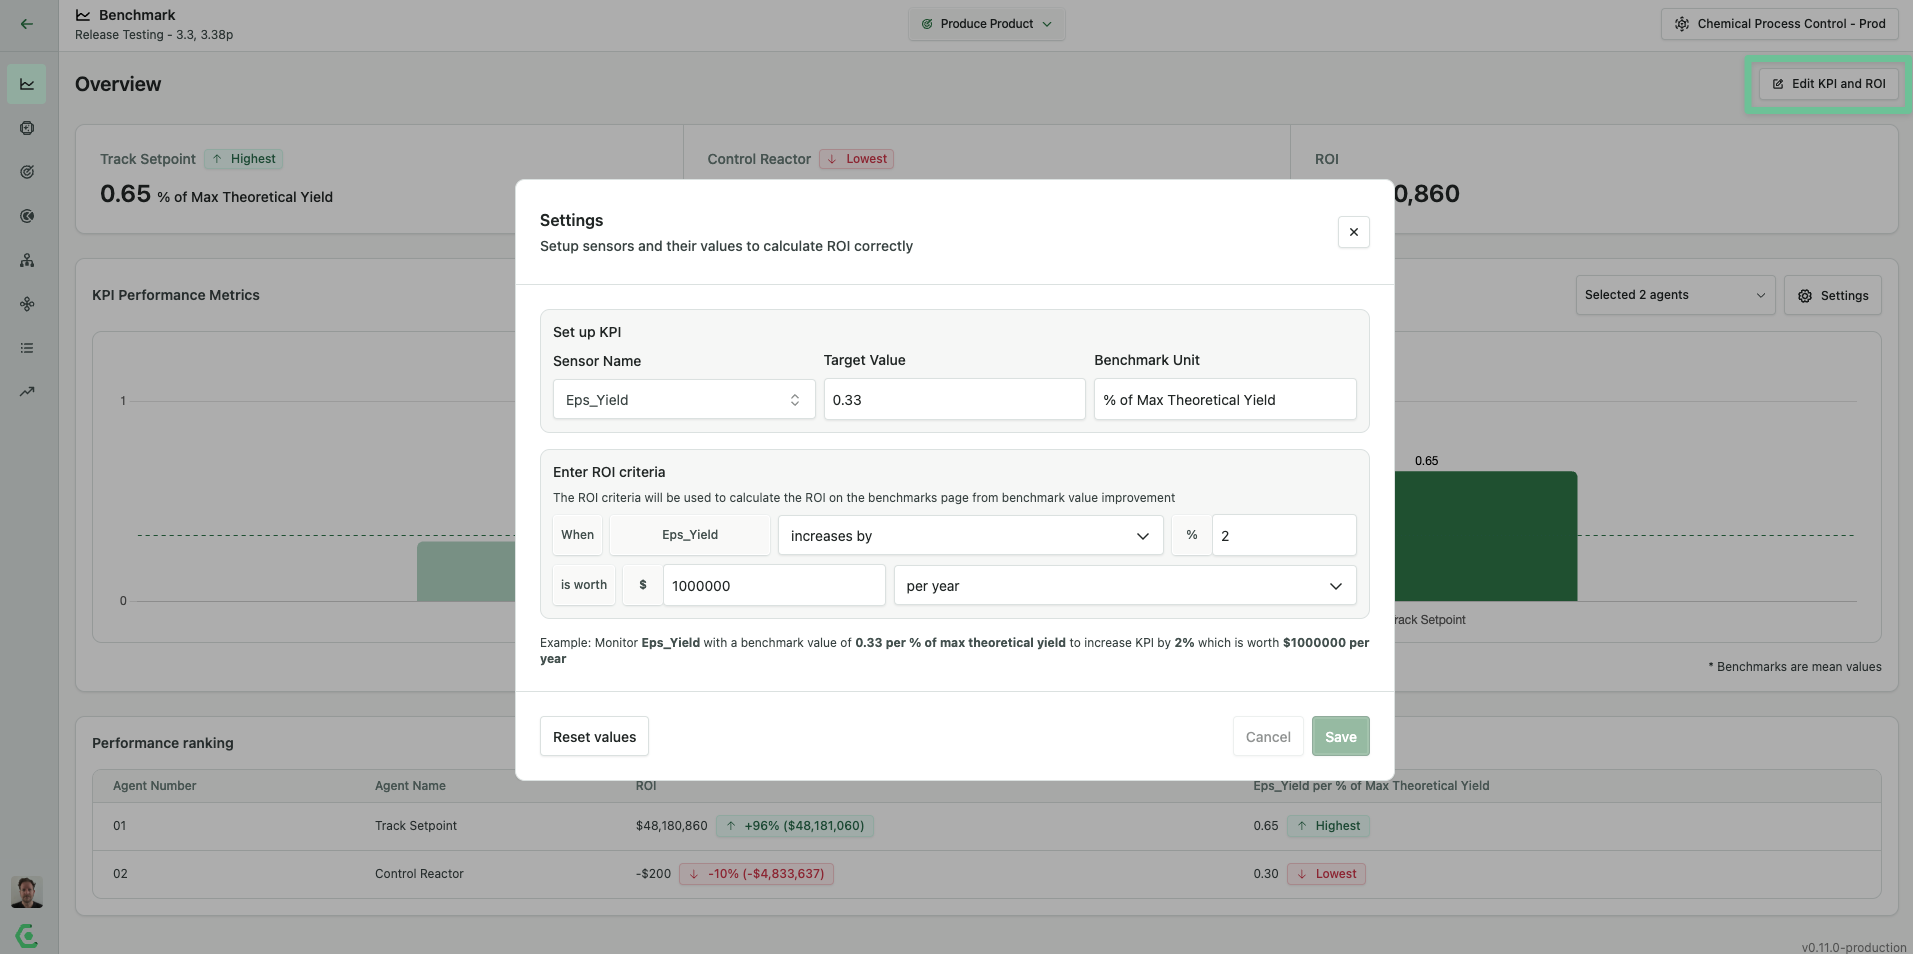
2. Click `Edit KPI and ROI` in the top right corner
3. In the "Set up KPI" section, configure the following:
* **Sensor Name**: Select a sensor or preceptor variable to track (e.g., "Eps\_Yield")
* **Target Value**: Set the desired target for this KPI (e.g., 0.33)
* **Benchmark Unit**: Select the unit of measurement (e.g., "% of Max Theoretical Yield"). Note that this is for UI readability only and doesn't affect calculations.
### Setting up ROI Calculations
Return on Investment (ROI) calculations help quantify the financial impact of your agents' performance. The ROI is calculated based on the monetary value of the difference between your target value and the actual value of the KPI generated by that agent system, minus training costs.
1. In the Settings modal, navigate to the "Enter ROI criteria" section
2. Define the conditions for calculating ROI:
* **When**: Select the metric to track (e.g., "Eps\_Yield")
* **Condition**: Choose how the metric changes (e.g., "increases by")
* **Percentage**: Enter the percentage change that matters (e.g., 2%)
* **Value**: Set the financial value of this change (e.g., $1,000,000)
* **Period**: Select the time period (e.g., "per year")
For example: "When Eps\_Yield increases by 1% of max theoretical yield, it is worth $1,000,000 per year."
You can change KPI and ROI settings at any time after training completes, and the benchmark results will be automatically recalculated. This allows you to explore different business scenarios without retraining your agent systems.
## Reading the Benchmarking Dashboard
### Understanding the Overview Panel
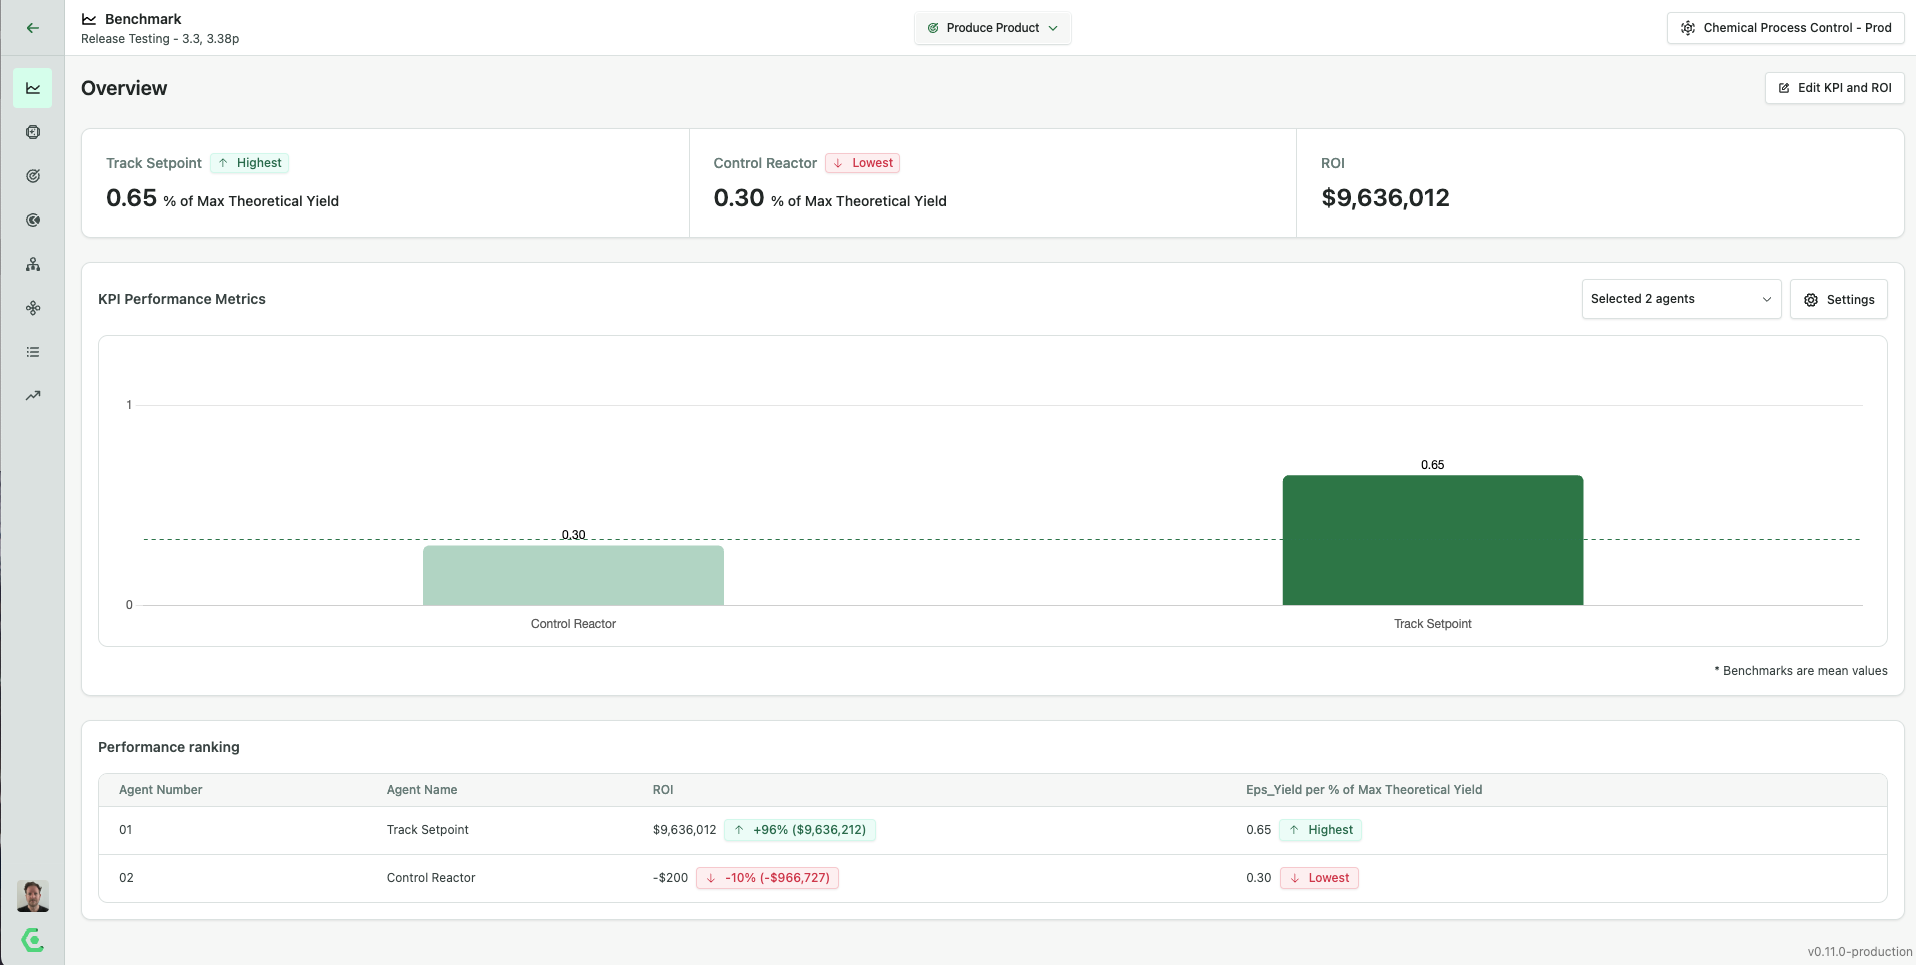
At the top of the benchmarking page, you'll find an Overview panel containing three key metrics:
* **Highest performing Agent System**: Displays the outcome of the highest performing agent system
* **Lowest performing Agent System**: Displays the outcome of the lowest performing agent system
* **ROI**: Shows the calculated financial return based on your KPI settings
Each metric displays both the value and the relevant unit (e.g., "% of Max Theoretical Yield").
### Bar Graph Visualization
The bar graph in the KPI Performance Metrics section provides a visual comparison of your agent systems:
* Each bar represents an agent system's performance on your selected KPI (all bars correspond to the same KPI)
* The height of the bar indicates the specific value of the KPI for that agent system (Y-axis)
* Horizontal dashed lines show benchmark averages
* The actual value of the KPI for each agent system is shown above the respective bar
### Performance Ranking Table
Below the graph is a detailed table showing:
* **Agent System Number**: Sequential ID for each agent system
* **Agent System Name**: Name or description of the agent system
* **ROI**: Calculated financial return based on the agent system's performance
* Green arrows (↑) indicate positive ROI with the percentage and absolute value
* Red arrows (↓) indicate negative ROI with the percentage and absolute value
* **Eps\_Yield (variable) per % of Max Theoretical Yield**: Performance metric with indicators for highest agent system performers
### Agent Formation Performance Plots
The last element on the Benchmarks page is a set of plots showing detailed information about performance on the KPI throughout the course of the benchmarking episode(s).
The green shows the value of the KPI at each point throughout the benchmarking episode. The red shows another sensor, which you can choose from a dropdown menu. This allows you to visualize not only the performance on the KPI over time, but also the KPI in relation to another key variable.
---
# Agent Instructions
This documentation is published with GitBook. GitBook is the documentation platform designed so that both humans and AI agents can read, navigate, and reason over technical content effectively. Learn more at gitbook.com.
## Querying This Documentation
If you need additional information that is not directly available in this page, you can query the documentation by asking a question.
Perform an HTTP GET request on the following URL with the `ask` and `goal` query parameters:
```
GET https://docs.amesa.com/evaluate-performance/set-kpi-and-roi.md?ask=&goal=
```
`ask` is the immediate question: it should be specific, self-contained, and written in natural language.
`goal` is what the user is ultimately trying to achieve, the reason they need the answer. Sharing it helps GitBook give you a better, more relevant answer. A goal is most helpful when it describes the outcome the user wants rather than restating the question. For example, with `ask=how do I create an API token`, a goal like `automate deployments from our CI pipeline` lets GitBook tailor the answer to that use case.
The response will contain a direct answer to the question and relevant excerpts and sources from the documentation.
Use this mechanism when the answer is not explicitly present in the current page, you need clarification or additional context, or you want to retrieve related documentation sections.